Key Indicators of Climate Change
Climate change isn’t just a theory—it’s visible, measurable, and accelerating. The most significant indicators include rising global temperatures, ocean heat and acidity, melting glaciers, sea level rise, and increasingly extreme weather patterns. These changes are primarily driven by human-induced increases in greenhouse gases like CO₂, methane, and nitrous oxide.
What the Data Tells Us: A Closer Look
| Indicator | Trend | Impact | Source |
|---|---|---|---|
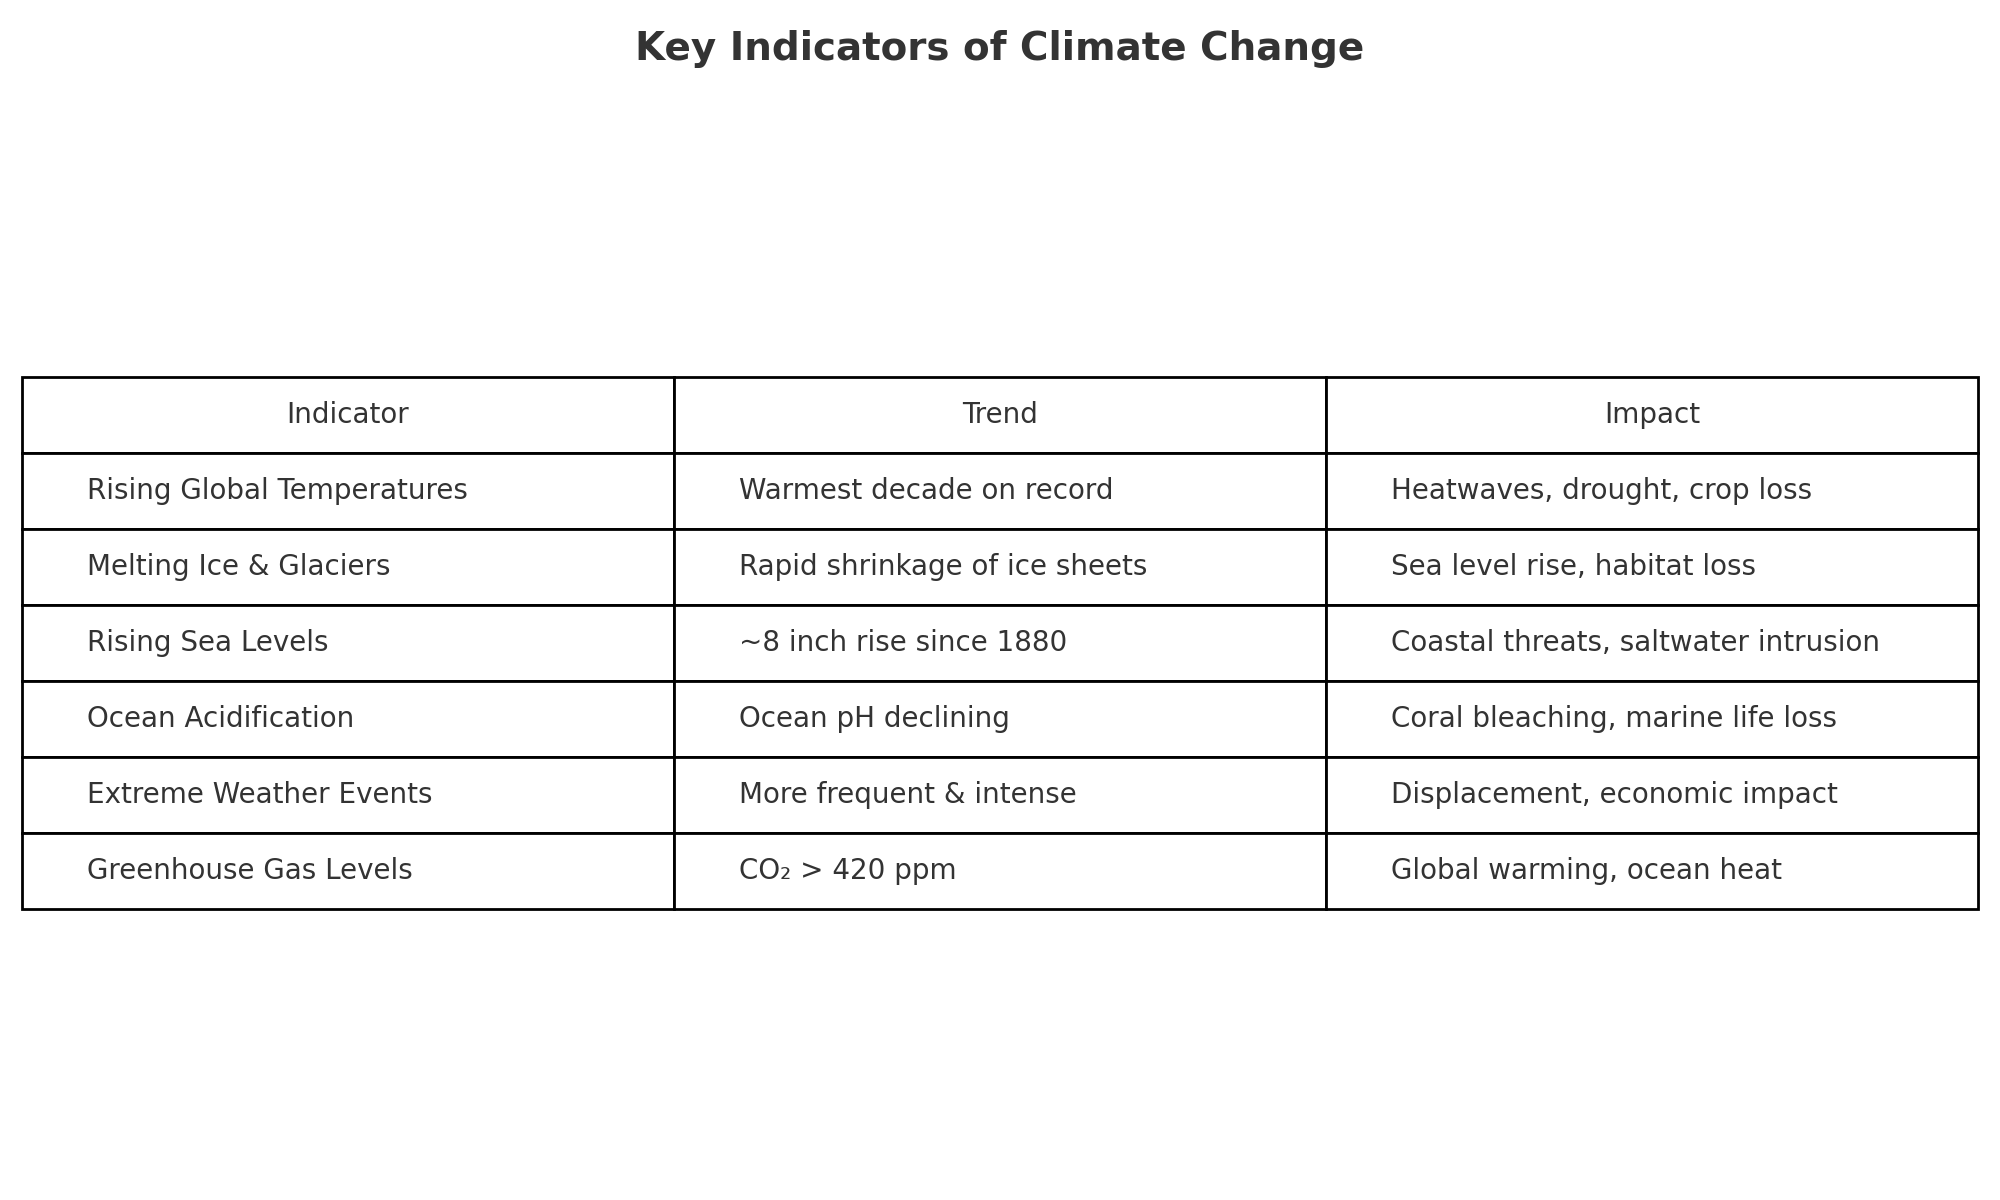
| Rising Global Temperatures | Past decade was the warmest on record | Increased heatwaves, drought, crop loss | WMO (2023), NOAA (2023) |
| Melting Ice & Glaciers | Arctic sea ice, glaciers, and ice sheets shrinking rapidly | Sea level rise, disrupted ecosystems | Union of Concerned Scientists, NASA (2023) |
| Rising Sea Levels | Global sea level rose ~8 inches since 1880 | Threatens coastal communities, saltwater intrusion | IPCC (2021), NOAA Sea Level Report Card (2022) |
| Ocean Acidification | Ocean pH declining due to CO₂ absorption | Coral bleaching, shellfish decline | NOAA Ocean Acidification Program, IPCC |
| Extreme Weather Events | More frequent/intense heatwaves, floods, droughts, wildfires | Displacement, economic loss, health crises | IPCC AR6 (2023), National Climate Assessment (USA, 2018) |
| Greenhouse Gas Levels | CO₂ > 420 ppm (highest in 3 million years) | Global warming, ocean heat uptake | NOAA ESRL, NASA Climate Change Data (2023) |
Supporting Citations
- World Meteorological Organization (WMO). (2023). State of the Global Climate Report.
- Union of Concerned Scientists. (2023). Climate Science Overview.
- NOAA Climate.gov. (2023). Global Climate Reports and Data.
- IPCC. (2021, 2023). Sixth Assessment Report.
- NASA Earth Observatory. (2023). Vital Signs: Ice Sheets and Sea Level.
- National Climate Assessment (U.S.). (2018). Climate Science Special Report.
- NOAA Ocean Acidification Program. (2022). The Role of CO₂ in Ocean Chemistry.